**Augustin Degomme and Arnaud Legrand**
This page describe how we compute the SMPI parameters based on a set of
point-to-point MPI measurements. The R code produces the XML snippet to
put in the simgrid XML file. A section on how to compute LogGPS
parameters from the same set of data is also included. The purpose of
this page is to provide anyone with all the information to check how our
analysis was conducted and to allow to build upon it.
We invite readers to read a full description of the model and its
validation in the article we submitted to SC13.
R initizalization
if(!require("plyr")) {
    print("trying to install plyr")
    install.packages("plyr", repos = "http://cran.r-project.org")
    if(require(plyr)){
        print("plyr installed and loaded")
    } else {
        stop("could not install plyr")
    }
}

if(!require("ggplot2")){
    print("trying to install ggplot2")
    install.packages("ggplot2", repos = "http://cran.r-project.org")
    if(require(ggplot2)){
        print("ggplot2 installed and loaded")
    } else {
        stop("could not install ggplot2")
    }
}

if(!require("XML")){
    print("trying to install XML")
    install.packages("XML", repos = "http://cran.r-project.org")
    if(require(XML)){
        print("XML installed and loaded")
    } else {
        stop("could not install XML")
    }
}

#library(plyr)
#library(ggplot2)
#library(segmented)
#library(XML)
Trace loading
| read_csv <- function(file) {
df <- read.csv(file, header=FALSE, strip.white=TRUE)
names(df) <- c("Nature","ResourceId","Type","Start","End","Duration","Imbrication","Value")
df = df[!(names(df) %in% c("Nature","Type", "Imbrication"))]
df$Origin=file
df
}
df_values <- read_csv('simgrid_graphene_switch2_4344.csv')
|
This comprises three sets of experiments:
- One for determining os and or using
MPISend and MPIRecv
- Its counterpart for determining the MPII* os
and or
- One for determining L and g|G with sequence of ping pong
Message size in all three sets of experiments are randomized to avoid
bias.
Split in measurement sets
1
2
3
4
5
6
7
8
9
10
11
12
13
14
15
16
17 | df_root <- df_values[df_values$ResourceId=="0",]
df_slave <- df_values[df_values$ResourceId=="1",]
df_rootseparatorsEnd <- df_root[df_root$Value=="MPI_Topo_test","End"]
# print(df_rootseparatorsEnd)
df_rootseparatorsStart <- df_root[df_root$Value=="MPI_Topo_test","Start"]
# print(df_rootseparatorsStart)
df_slaveseparatorsEnd <-df_slave[df_slave$Value=="MPI_Topo_test","End"]
df_slaveseparatorsEnd <- c(0, df_slaveseparatorsEnd)
num_mes <- length(df_rootseparatorsEnd)
df_root$xp=0
for(rank in 1:(num_mes-1)) {
df_root[df_root$Start>=df_rootseparatorsEnd[rank] & df_root$End<=df_rootseparatorsStart[rank+1],]$xp=rank
}
|
Link first set of measurements with injected workload
 1
 2
 3
 4
 5
 6
 7
 8
 9
10
11
12
13
14
15
16
17
18
19
20
21
22
23 | sizes<- read.csv('zoo_sizes', header=FALSE, strip.white=TRUE)
names(sizes) <- c("Size")
df_recv <- df_root[df_root$xp==1 & df_root$Value=="MPI_Recv",]
df_send <- df_root[df_root$xp==1 & df_root$Value=="MPI_Send",]
sizes <- sizes[sizes$Size<1000000,]
dr = data.frame(size=c())
for(i in 1:length(sizes)) {
d = data.frame(size=1:10)
d$Size = sizes[i];
dr = rbind(dr,d)
}
df_recv = cbind(df_recv,dr)
ds = data.frame(size=c())
for(i in 1:length(sizes)) {
d = data.frame(size=1:11)
d$Size = sizes[i];
ds = rbind(ds,d)
}
df_send = cbind(df_send,ds)
|
Link second set of measurements with injected workload
| df_isend <- df_root[df_root$xp==2 & df_root$Value=="MPI_Isend",]
ds = data.frame(size=c())
for(i in 1:length(sizes)) {
d = data.frame(size=1:10)
d$Size = sizes[i];
ds = rbind(ds,d)
}
df_isend = cbind(df_isend,ds)
|
Link third set of measurements with injected workload
1
2
3
4
5
6
7
8
9
10
11
12
13
14
15
16
17
18
19
20 | df_pingpong <- df_root[df_root$xp==3,]
df_sends <- df_pingpong[df_pingpong$Value=="MPI_Send",]
df_receives <- df_pingpong[df_pingpong$Value=="MPI_Recv",]
df_pingpong <- data.frame(ResourceId=unique(df_sends$ResourceId),
Start = df_sends$Start,
End = df_receives$End,
Duration = df_receives$Duration + df_sends$Duration,
Value = unique("pingpong"),
Origin = unique(df_sends$Origin),
xp= unique(df_sends$xp))
ds = data.frame(size=c())
for(i in 1:length(sizes)) {
d = data.frame(size=1:10)
d$Size = sizes[i];
ds = rbind(ds,d)
}
df_pingpong = cbind(df_pingpong,ds)
|
Define breakpoints
1
2
3
4
5
6
7
8
9
10
11
12 | async_threshold <- 65536
detached_threshold <- 327680
bp <- read.csv(text=" Limit, OsBound , OrBound, PingPongBound, Name
1420, 2e-5 , 2e-5 , 3e-4 , Small
32768, 1e-3 , 5e-5 , 2e-3 , Medium1
65536, 1e-3 , 12e-5 , 2e-3 , Medium2
327680, 1000000 , 1000000, 1000000 , Detached
1000000000, 1000000 , 1000000, 1000000 , Large",
header=TRUE, strip.white=TRUE)
v <- bp$Limit
bp$LimitInf <- c(0,v[1:length(v)-1])
bp$Name <- as.character(bp$Name)
|
Plotting functions
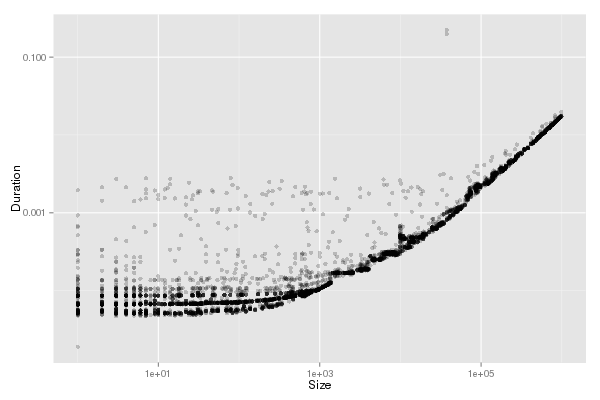
| basic_plot <- function(d) {
ggplot(data=d, aes(Size,Duration)) + geom_point(alpha=.2) +
scale_x_log10()+scale_y_log10()
}
|
SMPI
Model MPISend (piecewise os + k*Os)
 1
 2
 3
 4
 5
 6
 7
 8
 9
10
11
12
13
14
15
16
17
18
19
20
21
22
23
24
25
26
27
28
29
30
31
32
33
34
35
36
37
38
39
40
41
42
43
44
45
46
47
48
49
50
51
52
53 | classify_messages <- function(d, col_bound) {
d$group=as.character("outliers")
for(i in (1:length(bp$Limit))) {
d[d$Size < bp[i,]$Limit & d$Size >= bp[i,]$LimitInf & d$Duration<bp[i,col_bound],]$group = bp[i,]$Name
}
d
}
compute_lm <- function(bp, d, zone,remove_sync=FALSE,remove_detached=FALSE) {
if(remove_sync) {
group_list = bp[bp$Limit<=detached_threshold,]$Name
} else {
group_list = bp$Name
}
if(remove_detached) {
group_list = bp[bp$Limit<detached_threshold,]$Name
}
mylm <- ddply(d[d$group %in% (group_list),],
c("group"), function(x) {
model <- lm(Duration ~ Size, data = x)
coef(model)
})
intercept_label = paste0(zone,"Intercept")
size_label = paste0(zone,"Size")
bp[,intercept_label] = 0
bp[,size_label] = 0
for(i in (mylm$group)) {
bp[bp$Name == i,intercept_label] = mylm[mylm$group == i,"(Intercept)"]
bp[bp$Name == i,size_label] = mylm[mylm$group == i,"Size"]
}
bp
}
display_lm <- function(d,remove_sync=FALSE,remove_detached=FALSE) {
if(remove_sync) {
group_list = bp[bp$Limit<=detached_threshold,]$Name
} else {
group_list = bp$Name
}
if(remove_detached) {
group_list = bp[bp$Limit<detached_threshold,]$Name
}
for(i in (1:length(group_list))) {
print(paste0("----- ",bp[i,]$Name,"-----"))
lim <- bp[i,]$Limit
print(summary(lm(Duration ~ Size, data = d[d$group==bp[bp$Limit==lim,]$Name,])))
}
}
df_send <- classify_messages(df_send,"OsBound")
bp <- compute_lm(bp,df_send,"Os",remove_sync=T)
display_lm(df_send,remove_sync=T)
|
[1] "----- Small-----"
Call:
lm(formula = Duration ~ Size, data = d[d$group == bp[bp$Limit ==
lim, ]$Name, ])
Residuals:
Min 1Q Median 3Q Max
-5.148e-06 -5.866e-07 -1.344e-07 3.483e-07 1.046e-05
Coefficients:
Estimate Std. Error t value Pr(>|t|)
(Intercept) 8.930e-06 1.895e-08 471.19 <2e-16 ***
Size 7.654e-10 4.761e-11 16.08 <2e-16 ***
---
Signif. codes: 0 ‘***’ 0.001 ‘**’ 0.01 ‘*’ 0.05 ‘.’ 0.1 ‘ ’ 1
Residual standard error: 1.002e-06 on 3978 degrees of freedom
Multiple R-squared: 0.06102, Adjusted R-squared: 0.06078
F-statistic: 258.5 on 1 and 3978 DF, p-value: < 2.2e-16
[1] "----- Medium1-----"
Call:
lm(formula = Duration ~ Size, data = d[d$group == bp[bp$Limit ==
lim, ]$Name, ])
Residuals:
Min 1Q Median 3Q Max
-9.536e-06 -1.129e-06 -3.070e-08 1.072e-06 2.606e-05
Coefficients:
Estimate Std. Error t value Pr(>|t|)
(Intercept) 1.397e-05 7.711e-08 181.14 <2e-16 ***
Size 2.974e-10 5.617e-12 52.95 <2e-16 ***
---
Signif. codes: 0 ‘***’ 0.001 ‘**’ 0.01 ‘*’ 0.05 ‘.’ 0.1 ‘ ’ 1
Residual standard error: 1.898e-06 on 1593 degrees of freedom
Multiple R-squared: 0.6376, Adjusted R-squared: 0.6374
F-statistic: 2803 on 1 and 1593 DF, p-value: < 2.2e-16
[1] "----- Medium2-----"
Call:
lm(formula = Duration ~ Size, data = d[d$group == bp[bp$Limit ==
lim, ]$Name, ])
Residuals:
Min 1Q Median 3Q Max
-1.262e-05 -9.783e-07 -4.763e-07 5.691e-07 2.420e-05
Coefficients:
Estimate Std. Error t value Pr(>|t|)
(Intercept) 1.541e-05 9.010e-07 17.10 <2e-16 ***
Size 2.441e-10 1.933e-11 12.63 <2e-16 ***
---
Signif. codes: 0 ‘***’ 0.001 ‘**’ 0.01 ‘*’ 0.05 ‘.’ 0.1 ‘ ’ 1
Residual standard error: 2.622e-06 on 251 degrees of freedom
Multiple R-squared: 0.3886, Adjusted R-squared: 0.3862
F-statistic: 159.5 on 1 and 251 DF, p-value: < 2.2e-16
[1] "----- Detached-----"
Call:
lm(formula = Duration ~ Size, data = d[d$group == bp[bp$Limit ==
lim, ]$Name, ])
Residuals:
Min 1Q Median 3Q Max
-1.727e-04 -9.724e-05 3.288e-05 6.266e-05 2.979e-04
Coefficients:
Estimate Std. Error t value Pr(>|t|)
(Intercept) 2.420e-04 8.230e-06 29.41 <2e-16 ***
Size -2.652e-11 4.824e-11 -0.55 0.583
---
Signif. codes: 0 ‘***’ 0.001 ‘**’ 0.01 ‘*’ 0.05 ‘.’ 0.1 ‘ ’ 1
Residual standard error: 9.811e-05 on 922 degrees of freedom
Multiple R-squared: 0.0003276, Adjusted R-squared: -0.0007567
F-statistic: 0.3021 on 1 and 922 DF, p-value: 0.5827
Special treatment for detached mode as the Size parameter is not
significant
| group = bp[bp$Limit==detached_threshold,]$Name
mylm <- lm(Duration ~ 1, data = df_send[df_send$group==group,])
c_detached = coef(mylm)
bp[bp$Name == group,"OsIntercept"] = c_detached[[1]]
bp[bp$Name == group,"OsSize"] = 0
|
1
2
3
4
5
6
7
8
9
10
11
12
13
14
15
16
17
18
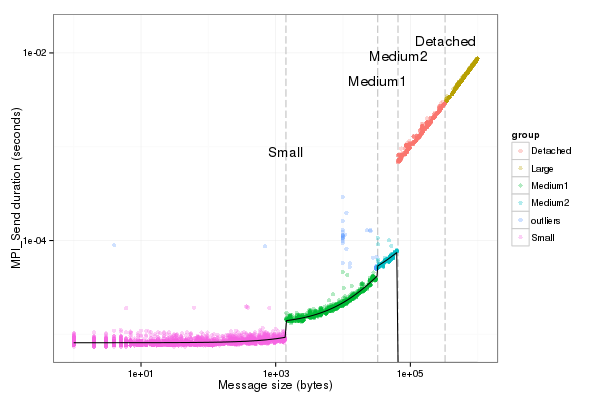
19 | comm_function <- function(x,zone) {
bp[x>=bp$LimitInf & x<bp$Limit,paste0(zone,"Intercept")] +
x * bp[x>=bp$LimitInf & x<bp$Limit,paste0(zone,"Size")]
}
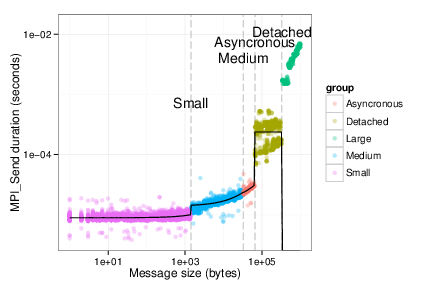
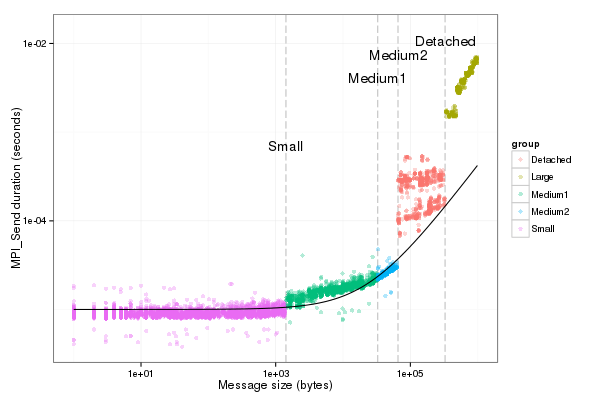
fancy_plot <- function(d,zone) {
d$values_test <- sapply(d$Size,function(x) {comm_function(x,zone)})
pl <- ggplot(data=d, aes(x=Size,y=Duration,color=group))
pl <- pl + geom_vline(xintercept=bp$Limit, colour="gray", linetype = "longdash") +
annotate("text", x=bp$Limit,
y=seq(.1*max(d$Duration),2*max(d$Duration),length.out=length(bp$Limit)),
label=bp$Name)
pl <- pl + geom_point(alpha=.3)
pl <- pl + geom_line(aes(x=Size,y=values_test), colour="black")
pl <- pl + scale_x_log10(limits=c(1, max(d$Size))) + scale_y_log10()
pl + ylab("MPI_Send duration (seconds)") + xlab("Message size (bytes)") + theme_bw() + scale_alpha(guide = "none")
}
fancy_plot(df_send[df_send$group!="outliers",],"Os")
|
Model MPIRecv (piecewise or + k*Or)
| df_recv <- classify_messages(df_recv,"OrBound")
bp <- compute_lm(bp, df_recv,"Or",remove_detached=TRUE)
display_lm(df_recv,remove_detached=TRUE)
|
[1] "----- Small-----"
Call:
lm(formula = Duration ~ Size, data = d[d$group == bp[bp$Limit ==
lim, ]$Name, ])
Residuals:
Min 1Q Median 3Q Max
-1.167e-06 -3.148e-07 -1.014e-07 1.811e-07 1.134e-05
Coefficients:
Estimate Std. Error t value Pr(>|t|)
(Intercept) 8.140e-06 1.348e-08 603.72 <2e-16 ***
Size 8.396e-10 3.389e-11 24.77 <2e-16 ***
---
Signif. codes: 0 ‘***’ 0.001 ‘**’ 0.01 ‘*’ 0.05 ‘.’ 0.1 ‘ ’ 1
Residual standard error: 6.805e-07 on 3626 degrees of freedom
Multiple R-squared: 0.1447, Adjusted R-squared: 0.1445
F-statistic: 613.6 on 1 and 3626 DF, p-value: < 2.2e-16
[1] "----- Medium1-----"
Call:
lm(formula = Duration ~ Size, data = d[d$group == bp[bp$Limit ==
lim, ]$Name, ])
Residuals:
Min 1Q Median 3Q Max
-2.945e-06 -6.824e-07 -2.118e-07 3.956e-07 2.432e-05
Coefficients:
Estimate Std. Error t value Pr(>|t|)
(Intercept) 1.270e-05 6.273e-08 202.5 <2e-16 ***
Size 9.092e-10 4.973e-12 182.8 <2e-16 ***
---
Signif. codes: 0 ‘***’ 0.001 ‘**’ 0.01 ‘*’ 0.05 ‘.’ 0.1 ‘ ’ 1
Residual standard error: 1.413e-06 on 1374 degrees of freedom
Multiple R-squared: 0.9605, Adjusted R-squared: 0.9605
F-statistic: 3.343e+04 on 1 and 1374 DF, p-value: < 2.2e-16
[1] "----- Medium2-----"
Call:
lm(formula = Duration ~ Size, data = d[d$group == bp[bp$Limit ==
lim, ]$Name, ])
Residuals:
Min 1Q Median 3Q Max
-6.351e-06 -2.408e-06 -4.990e-07 1.274e-06 5.252e-05
Coefficients:
Estimate Std. Error t value Pr(>|t|)
(Intercept) 3.096e-05 2.048e-06 15.12 <2e-16 ***
Size 6.956e-10 4.392e-11 15.84 <2e-16 ***
---
Signif. codes: 0 ‘***’ 0.001 ‘**’ 0.01 ‘*’ 0.05 ‘.’ 0.1 ‘ ’ 1
Residual standard error: 5.682e-06 on 228 degrees of freedom
Multiple R-squared: 0.5239, Adjusted R-squared: 0.5218
F-statistic: 250.9 on 1 and 228 DF, p-value: < 2.2e-16
Model Transfer time (piecewise l+ k*[g|G])
Let's analyze the Ping Pong experiment. We assume it was done using a
simple send+recv. Let's sum the times taken by the pair on node 0, let's
forget node 1.
| df_pingpong <- classify_messages(df_pingpong,"PingPongBound")
bp <- compute_lm(bp, df_pingpong,"PingPong")
display_lm(df_pingpong)
|
[1] "----- Small-----"
Call:
lm(formula = Duration ~ Size, data = d[d$group == bp[bp$Limit ==
lim, ]$Name, ])
Residuals:
Min 1Q Median 3Q Max
-5.414e-05 -9.222e-06 -6.302e-06 9.010e-07 2.222e-04
Coefficients:
Estimate Std. Error t value Pr(>|t|)
(Intercept) 7.318e-05 5.476e-07 133.63 <2e-16 ***
Size 4.074e-08 1.379e-09 29.54 <2e-16 ***
---
Signif. codes: 0 ‘***’ 0.001 ‘**’ 0.01 ‘*’ 0.05 ‘.’ 0.1 ‘ ’ 1
Residual standard error: 2.725e-05 on 3521 degrees of freedom
Multiple R-squared: 0.1986, Adjusted R-squared: 0.1983
F-statistic: 872.4 on 1 and 3521 DF, p-value: < 2.2e-16
[1] "----- Medium1-----"
Call:
lm(formula = Duration ~ Size, data = d[d$group == bp[bp$Limit ==
lim, ]$Name, ])
Residuals:
Min 1Q Median 3Q Max
-7.655e-05 -4.697e-05 -2.416e-05 -3.400e-06 1.546e-03
Coefficients:
Estimate Std. Error t value Pr(>|t|)
(Intercept) 1.777e-04 5.812e-06 30.57 <2e-16 ***
Size 1.842e-08 4.234e-10 43.51 <2e-16 ***
---
Signif. codes: 0 ‘***’ 0.001 ‘**’ 0.01 ‘*’ 0.05 ‘.’ 0.1 ‘ ’ 1
Residual standard error: 0.000136 on 1437 degrees of freedom
Multiple R-squared: 0.5685, Adjusted R-squared: 0.5682
F-statistic: 1893 on 1 and 1437 DF, p-value: < 2.2e-16
[1] "----- Medium2-----"
Call:
lm(formula = Duration ~ Size, data = d[d$group == bp[bp$Limit ==
lim, ]$Name, ])
Residuals:
Min 1Q Median 3Q Max
-1.175e-04 -6.066e-05 -3.421e-05 3.739e-05 1.139e-03
Coefficients:
Estimate Std. Error t value Pr(>|t|)
(Intercept) 3.056e-04 4.443e-05 6.879 5.97e-11 ***
Size 1.553e-08 9.502e-10 16.348 < 2e-16 ***
---
Signif. codes: 0 ‘***’ 0.001 ‘**’ 0.01 ‘*’ 0.05 ‘.’ 0.1 ‘ ’ 1
Residual standard error: 0.0001219 on 224 degrees of freedom
Multiple R-squared: 0.544, Adjusted R-squared: 0.542
F-statistic: 267.3 on 1 and 224 DF, p-value: < 2.2e-16
[1] "----- Detached-----"
Call:
lm(formula = Duration ~ Size, data = d[d$group == bp[bp$Limit ==
lim, ]$Name, ])
Residuals:
Min 1Q Median 3Q Max
-2.937e-04 -1.823e-04 -4.085e-05 1.142e-04 2.332e-03
Coefficients:
Estimate Std. Error t value Pr(>|t|)
(Intercept) 5.754e-04 2.449e-05 23.49 <2e-16 ***
Size 1.673e-08 1.436e-10 116.57 <2e-16 ***
---
Signif. codes: 0 ‘***’ 0.001 ‘**’ 0.01 ‘*’ 0.05 ‘.’ 0.1 ‘ ’ 1
Residual standard error: 0.0002784 on 838 degrees of freedom
Multiple R-squared: 0.9419, Adjusted R-squared: 0.9418
F-statistic: 1.359e+04 on 1 and 838 DF, p-value: < 2.2e-16
[1] "----- Large-----"
Call:
lm(formula = Duration ~ Size, data = d[d$group == bp[bp$Limit ==
lim, ]$Name, ])
Residuals:
Min 1Q Median 3Q Max
-0.0004040 -0.0002220 -0.0000752 0.0000947 0.0031745
Coefficients:
Estimate Std. Error t value Pr(>|t|)
(Intercept) 4.632e-04 7.120e-05 6.506 1.99e-10 ***
Size 1.721e-08 1.060e-10 162.253 < 2e-16 ***
---
Signif. codes: 0 ‘***’ 0.001 ‘**’ 0.01 ‘*’ 0.05 ‘.’ 0.1 ‘ ’ 1
Residual standard error: 0.0004066 on 468 degrees of freedom
Multiple R-squared: 0.9825, Adjusted R-squared: 0.9825
F-statistic: 2.633e+04 on 1 and 468 DF, p-value: < 2.2e-16
| fancy_plot(df_pingpong,"PingPong")
|
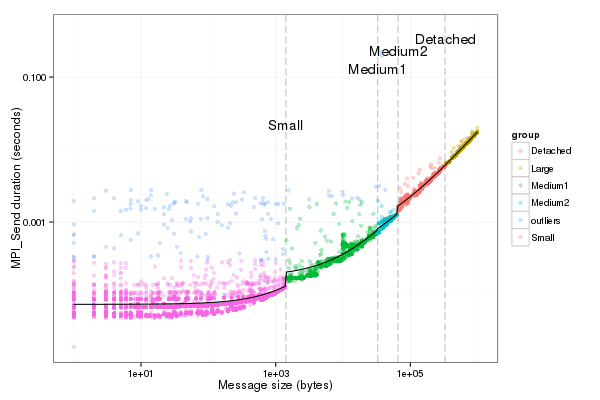
Since we ensured in the experiments that receiver is ready, we have
pingpong = 2or+2transfer for small messages that are sent
asynchronously. For large sizes, communications are synchronous, hence
we have pingpong = 2transfer.
1
2
3
4
5
6
7
8
9
10
11
12
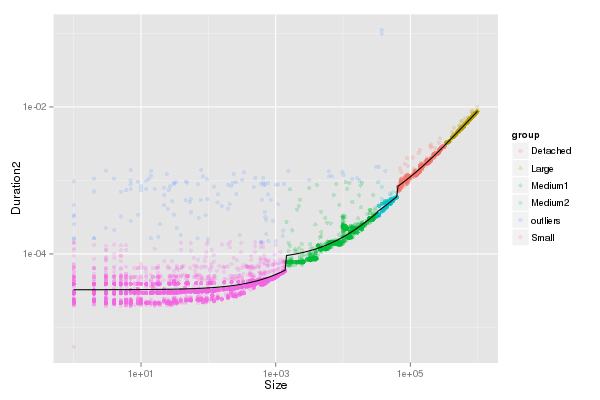
13 | ### lm of Or is 0 above async_threshold so we can safely substract
bp$DelayIntercept <- (bp$PingPongIntercept-bp$OrIntercept)/2
bp$DelaySize <- (bp$PingPongSize-bp$OrSize)/2
df_pingpong$values_test2 <- sapply(df_pingpong$Size,
function(x) {comm_function(x,"Delay")})
df_pingpong$Duration2 = (df_pingpong$Duration -
sapply(df_pingpong$Size,function(x) {comm_function(x,"Or")}))/2
pl <- ggplot(data=df_pingpong, aes(x=Size,y=Duration2,color=group))+geom_point(alpha=.2)
pl <- pl + geom_vline(xintercept=c(limit_small,limit_medium,limit_mediump,limit_medium_large), colour="black", linetype = "longdash")
pl + geom_line(aes(x=Size,y=values_test2), colour="black") +scale_x_log10()+scale_y_log10()
|
XML export for latency and bandwidth
1
2
3
4
5
6
7
8
9
10
11
12
13
14
15 | desc=data.frame()
desc=rbind(desc, ddply(bp,c("Name"), summarize, Name="smpi/os",Limit=Limit, desc=paste0(LimitInf,":",OsIntercept,":",OsSize)))
desc=rbind(desc, ddply(bp,c("Name"), summarize, Name="smpi/or",Limit=Limit, desc=paste0(LimitInf,":",OrIntercept,":",OrSize)))
desc=rbind(desc, ddply(bp,c("Name"), summarize, Name="smpi/bw_factor",Limit=Limit, desc=paste0(LimitInf,":",1/(DelaySize*1.25E8))))
desc=rbind(desc, ddply(bp,c("Name"), summarize, Name="smpi/lat_factor",Limit=Limit, desc=paste0(LimitInf,":",DelayIntercept/2.4E-5)))
desc <- desc[with(desc, order(Name,Limit)),]
desc <- ddply(desc,c("Name"),summarize,label=paste(desc,collapse = ';'))
as <- xmlNode("prop", attrs = c(id="smpi/async_small_thres", value=async_threshold))
de <- xmlNode("prop", attrs = c(id="smpi/send_is_detached_thres", value= detached_threshold))
bw <- xmlNode("prop", attrs = c(id="smpi/bw_factor", value=desc[desc$Name=="smpi/bw_factor",]$label))
lat <- xmlNode("prop", attrs = c(id="smpi/lat_factor", value=desc[desc$Name=="smpi/lat_factor",]$label))
os <- xmlNode("prop", attrs = c(id="smpi/os", value=desc[desc$Name=="smpi/os",]$label))
or <- xmlNode("prop", attrs = c(id="smpi/or", value=desc[desc$Name=="smpi/or",]$label))
|
Export XML
a <- xmlNode("config", attrs = c(id="General"), os, or, bw, lat, as, de)
saveXML(a, file="testXML.xml")
<?xml version="1.0"?>
<config id="General">
<prop id="smpi/os" value="0:8.9300920419081e-06:7.65438202550106e-10;1420:1.39684254077781e-05:2.97409403415968e-10;32768:1.54082820250394e-05:2.44104034252286e-10;65536:0.000237866424242424:0;327680:0:0"/>
<prop id="smpi/or" value="0:8.14025462333494e-06:8.3958813204998e-10;1420:1.26995184134793e-05:9.09218191293861e-10;32768:3.09570602567453e-05:6.95645307772806e-10;65536:0:0;327680:0:0"/>
<prop id="smpi/bw_factor" value="0:0.400976530736138;1420:0.913555534273577;32768:1.07831886657594;65536:0.956083935262915;327680:0.929867998857892"/>
<prop id="smpi/lat_factor" value="0:1.35489260823384;1420:3.43725032107889;32768:5.72164710873587;65536:11.9885319715471;327680:9.65041953605594"/>
<prop id="smpi/async_small_thres" value="65536"/>
<prop id="smpi/send_is_detached_thres" value="327680"/>
</config>
LogGPS
| summary(lm(data=df_send[df_send$Size<65536,],Duration~Size))
c_os = coef(lm(data=df_send[df_send$Size<65536,],Duration~Size))
bp$LogGP_OsIntercept = c_os["(Intercept)"]
bp$LogGP_OsSize = c_os["Size"]
|
Call:
lm(formula = Duration ~ Size, data = df_send[df_send$Size < 65536,
])
Residuals:
Min 1Q Median 3Q Max
-1.616e-05 -1.453e-06 -9.650e-07 9.370e-07 1.042e-04
Coefficients:
Estimate Std. Error t value Pr(>|t|)
(Intercept) 1.002e-05 4.488e-08 223.4 <2e-16 ***
Size 4.156e-10 3.718e-12 111.8 <2e-16 ***
---
Signif. codes: 0 ‘***’ 0.001 ‘**’ 0.01 ‘*’ 0.05 ‘.’ 0.1 ‘ ’ 1
Residual standard error: 3.11e-06 on 5839 degrees of freedom
Multiple R-squared: 0.6816, Adjusted R-squared: 0.6815
F-statistic: 1.25e+04 on 1 and 5839 DF, p-value: < 2.2e-16
Hence,
\<prop id="smpi/os" value="0:1.002323e-05:4.155907e-10"/>
| summary(lm(data=df_recv[df_recv$Size<65536,],Duration~Size))
c_or = coef(lm(data=df_recv[df_recv$Size<65536,],Duration~Size))
bp$LogGP_OrIntercept = c_or["(Intercept)"]
bp$LogGP_OrSize = c_or["Size"]
|
Call:
lm(formula = Duration ~ Size, data = df_recv[df_recv$Size < 65536,
])
Residuals:
Min 1Q Median 3Q Max
-1.087e-05 -1.276e-06 -9.350e-07 -8.700e-08 2.712e-04
Coefficients:
Estimate Std. Error t value Pr(>|t|)
(Intercept) 9.002e-06 1.142e-07 78.81 <2e-16 ***
Size 1.200e-09 9.463e-12 126.81 <2e-16 ***
---
Signif. codes: 0 ‘***’ 0.001 ‘**’ 0.01 ‘*’ 0.05 ‘.’ 0.1 ‘ ’ 1
Residual standard error: 7.549e-06 on 5308 degrees of freedom
Multiple R-squared: 0.7518, Adjusted R-squared: 0.7518
F-statistic: 1.608e+04 on 1 and 5308 DF, p-value: < 2.2e-16
- Delay [0:1420] et [1420:…]
 1
 2
 3
 4
 5
 6
 7
 8
 9
10
11
12
13
14
15
16
17
18
19
20
21
22
23
24 | df_pingpong$Mode = 0
df_pingpong[df_pingpong$Size < 1420,]$Mode = 1
df_pingpong$Mode=as.factor(df_pingpong$Mode)
df_pingpong$Duration3 <- (df_pingpong$Duration -
sapply(df_pingpong$Size, function(x) {comm_function(x,"LogGP_Or")}) -
sapply(df_pingpong$Size, function(x) {comm_function(x,"LogGP_Os")}))/2
#remove outliers
df_pingpong <- df_pingpong[df_pingpong$Duration3<.1,]
#LogGP_lm <- lm(data=df_pingpong,Duration3~Size:Mode+Size)
Lg_lm <- lm(data=df_pingpong[df_pingpong$Mode==1,],Duration3~Size)
summary(Lg_lm)
c_Lg = coef(Lg_lm)
Lg <- c_Lg["(Intercept)"]
g <- c_Lg["Size"]
LG <- (Lg + g*1420)
df_pingpong$Duration4 <- df_pingpong$Duration3 - LG
df_pingpong[df_pingpong$Mode==1,]$Duration4 <- df_pingpong[df_pingpong$Mode==1,]$Duration3
G_lm <- lm(data=df_pingpong[df_pingpong$Mode==0,],Duration4~Size+0)
summary(G_lm)
c_G = coef(G_lm)
G <- c_G["Size"]
|
Call:
lm(formula = Duration3 ~ Size, data = df_pingpong[df_pingpong$Mode ==
1, ])
Residuals:
Min 1Q Median 3Q Max
-4.494e-05 -2.228e-05 -2.099e-05 -1.455e-05 1.340e-03
Coefficients:
Estimate Std. Error t value Pr(>|t|)
(Intercept) 4.494e-05 2.376e-06 18.915 < 2e-16 ***
Size 1.953e-08 5.972e-09 3.271 0.00108 **
---
Signif. codes: 0 ‘***’ 0.001 ‘**’ 0.01 ‘*’ 0.05 ‘.’ 0.1 ‘ ’ 1
Residual standard error: 0.0001199 on 3628 degrees of freedom
Multiple R-squared: 0.00294, Adjusted R-squared: 0.002666
F-statistic: 10.7 on 1 and 3628 DF, p-value: 0.001082
Call:
lm(formula = Duration4 ~ Size + 0, data = df_pingpong[df_pingpong$Mode ==
0, ])
Residuals:
Min 1Q Median 3Q Max
-0.000350 -0.000016 0.000002 0.000064 0.099069
Coefficients:
Estimate Std. Error t value Pr(>|t|)
Size 8.096e-09 1.181e-10 68.53 <2e-16 ***
---
Signif. codes: 0 ‘***’ 0.001 ‘**’ 0.01 ‘*’ 0.05 ‘.’ 0.1 ‘ ’ 1
Residual standard error: 0.001819 on 2988 degrees of freedom
Multiple R-squared: 0.6112, Adjusted R-squared: 0.611
F-statistic: 4696 on 1 and 2988 DF, p-value: < 2.2e-16
| bp$LogGP_DelayIntercept = LG
bp$LogGP_DelaySize = G
bp[bp$Limit<=1420,]$LogGP_DelayIntercept = Lg
bp[bp$Limit<=1420,]$LogGP_DelaySize = g
|
Export XML
 1
 2
 3
 4
 5
 6
 7
 8
 9
10
11
12
13
14
15
16
17
18 | desc=data.frame()
desc=rbind(desc, ddply(bp,c("Name"), summarize, Name="smpi/os",Limit=Limit, desc=paste0(LimitInf,":",LogGP_OsIntercept,":",LogGP_OsSize)))
desc=rbind(desc, ddply(bp,c("Name"), summarize, Name="smpi/or",Limit=Limit, desc=paste0(LimitInf,":",LogGP_OrIntercept,":",LogGP_OrSize)))
desc=rbind(desc, ddply(bp,c("Name"), summarize, Name="smpi/bw_factor",Limit=Limit, desc=paste0(LimitInf,":",1/(LogGP_DelaySize*1.25E8))))
desc=rbind(desc, ddply(bp,c("Name"), summarize, Name="smpi/lat_factor",Limit=Limit, desc=paste0(LimitInf,":",LogGP_DelayIntercept/2.4E-5)))
desc <- desc[with(desc, order(Name,Limit)),]
desc <- ddply(desc,c("Name"),summarize,label=paste(desc,collapse = ';'))
as <- xmlNode("prop", attrs = c(id="smpi/async_small_thres", value="65536"))
de <- xmlNode("prop", attrs = c(id="smpi/send_is_detached_thres", value="65536"))
bw <- xmlNode("prop", attrs = c(id="smpi/bw_factor", value=desc[desc$Name=="smpi/bw_factor",]$label))
lat <- xmlNode("prop", attrs = c(id="smpi/lat_factor", value=desc[desc$Name=="smpi/lat_factor",]$label))
os <- xmlNode("prop", attrs = c(id="smpi/os", value=desc[desc$Name=="smpi/os",]$label))
or <- xmlNode("prop", attrs = c(id="smpi/or", value=desc[desc$Name=="smpi/or",]$label))
a <- xmlNode("config", attrs = c(id="General"), os, or, bw, lat, as, de)
saveXML(a, file="LogGPS.xml")
|
<?xml version="1.0"?>
<config id="General">
 <prop id="smpi/os" value="0:1.00232317408165e-05:4.15590748439781e-10;1420:1.00232317408165e-05:4.15590748439781e-10;32768:1.00232317408165e-05:4.15590748439781e-10;65536:1.00232317408165e-05:4.15590748439781e-10;327680:1.00232317408165e-05:4.15590748439781e-10"/>
 <prop id="smpi/or" value="0:9.00185524188329e-06:1.19998810064746e-09;1420:9.00185524188329e-06:1.19998810064746e-09;32768:9.00185524188329e-06:1.19998810064746e-09;65536:9.00185524188329e-06:1.19998810064746e-09;327680:9.00185524188329e-06:1.19998810064746e-09"/>
 <prop id="smpi/bw_factor" value="0:0.409556304333763;1420:0.988092528012222;32768:0.988092528012222;65536:0.988092528012222;327680:0.988092528012222"/>
 <prop id="smpi/lat_factor" value="0:1.87252265739663;1420:3.02824490687664;32768:3.02824490687664;65536:3.02824490687664;327680:3.02824490687664"/>
 <prop id="smpi/async_small_thres" value="65536"/>
 <prop id="smpi/send_is_detached_thres" value="65536"/>
</config>
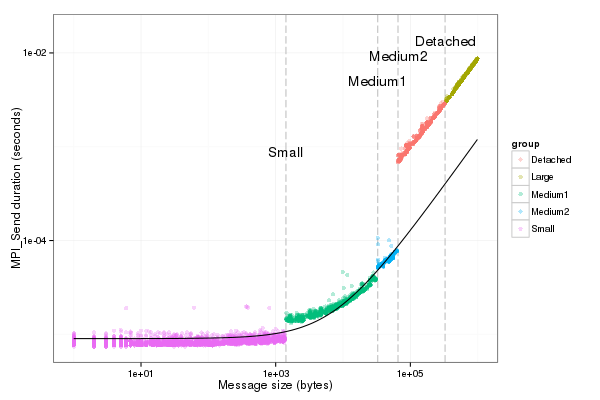
Graphical check for Os
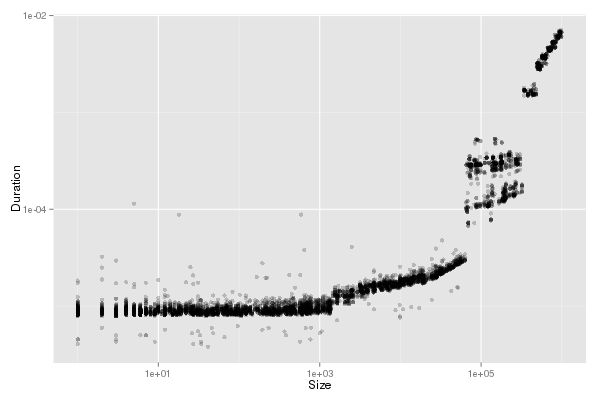
| fancy_plot(df_send[df_send$group!="outliers",],"LogGP_Os")
|
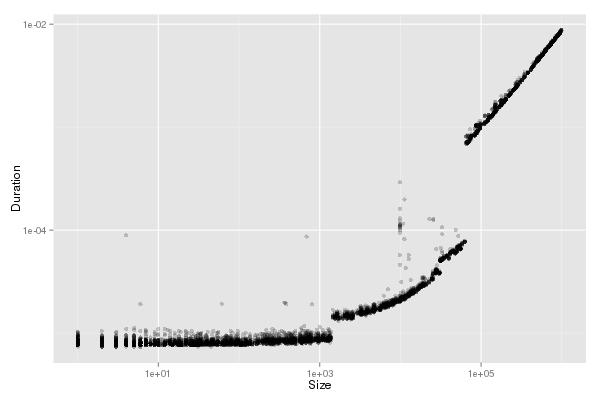
Graphical check for Or
| fancy_plot(df_recv[df_recv$group!="outliers",],"LogGP_Or")
|
Graphical check for pingpong
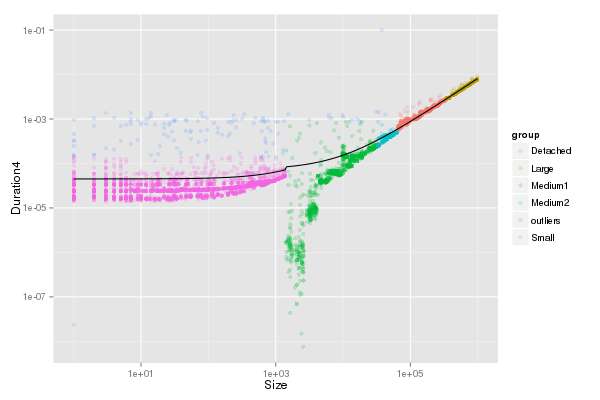
| df_pingpong$values_test2 <- sapply(df_pingpong$Size,
function(x) {comm_function(x,"LogGP_Delay")})
pl <- ggplot(data=df_pingpong, aes(x=Size,y=Duration4,color=group))+geom_point(alpha=.2)
pl <- pl + geom_vline(xintercept=c(limit_small,limit_medium,limit_mediump,limit_medium_large), colour="black", linetype = "longdash")
pl + geom_line(aes(x=Size,y=values_test2), colour="black") +scale_x_log10()+scale_y_log10()
|